My father retired in 2019 with what he described, with total confidence, as plenty. He had run the numbers himself on the back of a pension statement. Eighteen months later he rang me on a Sunday evening and asked, in a voice I had not heard him use before, whether I thought he had made a mistake. He had not accounted for two things: the fact that his spending in early retirement went up rather than down, and the fact that markets do not deliver the average return in the order that spreadsheets assume.
He is fine now. We rebuilt the plan together over a few weekends, cut the drawdown for two years, and delayed his state pension claim. But that phone call is why I take the retirement number question seriously, and why I distrust every article that answers it with a single figure like one million dollars.

Start with spending, not with a round number
Your retirement number is driven by one input above all others: what you will spend in a year once you stop working. Everything else is arithmetic around that figure. Take your current annual spending, remove commuting costs, remove pension contributions, remove the mortgage if it will be paid off, then add health costs, add more travel in the first decade, and add a realistic allowance for home and car replacement.
Most people land somewhere between 70 and 85 percent of their pre retirement spending. My father landed at 104 percent for the first three years, because a person with time and health spends money. Plan for that shape rather than for a straight line.
Then multiply, carefully
The classic rule of thumb multiplies annual spending by 25, which is the same as assuming a 4 percent withdrawal rate. It came from US research on 30 year retirements using a portfolio of domestic stocks and bonds. It is a useful anchor and a poor commandment. Longer retirements, higher fees, and lower starting yields all argue for something more cautious, often 3.25 to 3.75 percent.
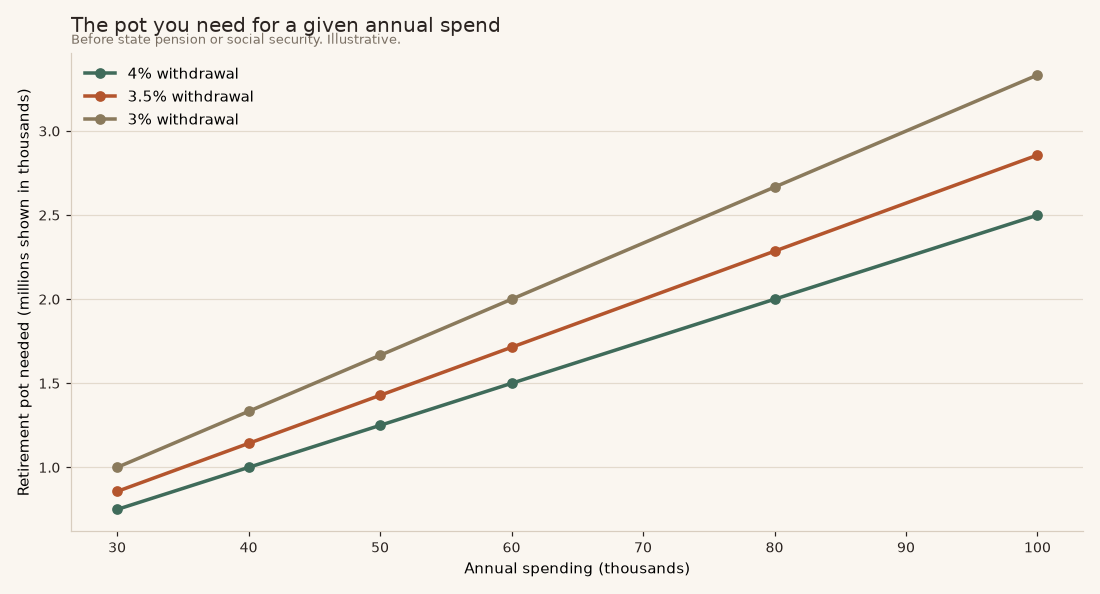
| Annual spend from the pot | At 4 percent | At 3.5 percent | At 3 percent |
|---|---|---|---|
| 30,000 | 750,000 | 857,000 | 1,000,000 |
| 40,000 | 1,000,000 | 1,143,000 | 1,333,000 |
| 50,000 | 1,250,000 | 1,429,000 | 1,667,000 |
| 70,000 | 1,750,000 | 2,000,000 | 2,333,000 |
Subtract the income you will already receive
This is the step that makes the numbers above far less frightening, and the step most people skip. State provision does a lot of heavy lifting.
In the UK the new State Pension is worth a little under 12,000 pounds a year for someone with a full National Insurance record. For a couple that is close to 24,000 pounds of inflation linked, guaranteed income. In the US, average Social Security retirement benefits sit near 24,000 dollars a year per person, with higher earners receiving considerably more and delaying to age 70 raising the payment substantially.
So a UK couple targeting 45,000 pounds a year of spending may only need their portfolio to cover around 21,000 pounds of it. At a 3.5 percent withdrawal rate that is a pot of roughly 600,000 pounds, not 1.29 million. Any defined benefit pension, rental income or annuity reduces it further. Check your actual forecast rather than guessing: the UK state pension forecast and the US Social Security statement are both free and take minutes.
Sequence risk, the thing that caught my father out
Two retirees can experience the exact same average return over 30 years and end up in completely different places, purely because of the order in which those returns arrived. Poor returns in the first five years, while you are also withdrawing, permanently shrink the base that later growth has to work on.
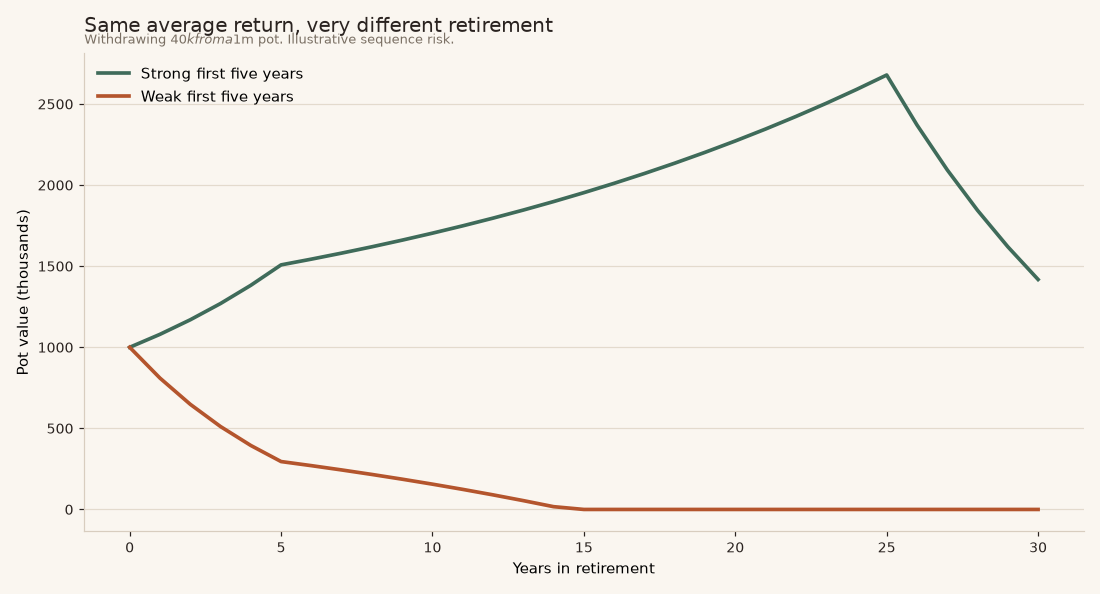
Three defences work, and none of them require market timing. Hold two to three years of spending in cash and short bonds so you never sell equities into a crash. Use a flexible withdrawal rule, cutting spending by around 10 percent after a year in which the portfolio falls significantly. And keep some optional spending in the plan that can genuinely be switched off, which for my father was two long haul trips.
What to contribute, depending on when you start
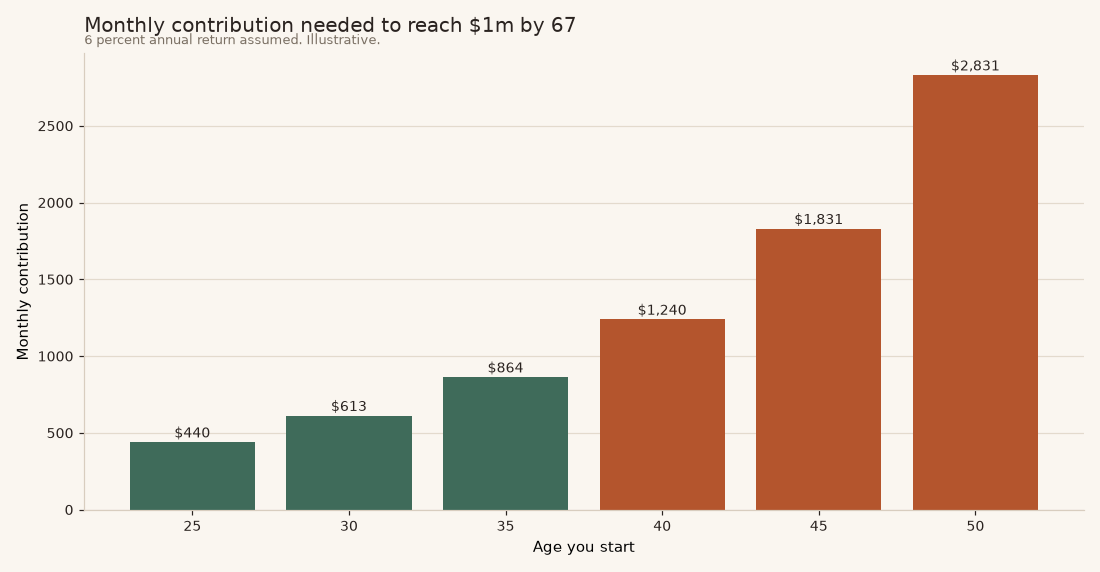
A useful set of milestones, expressed as multiples of salary, keeps you honest along the way. Roughly one times salary saved by 30, three times by 40, six times by 50, eight times by 60, and ten times by 67. These are guides rather than targets, and they assume state provision on top. If you are behind, the two effective moves are increasing contributions with each pay rise and, if you are over 50, using catch up allowances where your country offers them.
The portfolio through the transition
| Stage | Rough equity share | Reasoning |
|---|---|---|
| 20 or more years out | 90 to 100 percent | Time to recover from any decline. Growth is the priority. |
| 10 years out | 75 to 85 percent | Begin building the bond and cash side deliberately. |
| Retirement date | 55 to 70 percent | Plus two to three years of spending held in cash. |
| Ten years into retirement | 50 to 65 percent | Equities still needed. A 30 year retirement is still a long horizon. |
Going entirely to bonds and cash at 65 feels safe and is usually the riskier choice, because inflation over a 30 year retirement can halve purchasing power. You can see that effect for yourself in our inflation erosion calculator. For the defensive side of a portfolio near retirement, our piece on recession proof ETFs covers the funds usually used for that job.
Tax wrappers change the answer materially
A pound inside a pension or a Roth account is not the same as a pound in a taxable account. UK pension contributions receive tax relief at your marginal rate and 25 percent of the pot is normally tax free at withdrawal, while ISA money is tax free throughout but receives no relief going in. In the US, traditional 401k and IRA contributions reduce taxable income now and are taxed on withdrawal, while Roth accounts do the reverse.
The practical approach for most people is to hold a mix, so that in retirement you can draw from different pots to manage your tax band year by year. That flexibility is worth real money, often more than an extra half percent of investment return.
A one hour exercise to get your own number
Write down your current annual spending from twelve months of bank statements. Adjust it for retirement as described above. Request your state pension or Social Security forecast and subtract that income. Divide the remainder by 0.035. Compare the result with your current pension and investment balances. Then use the contribution chart above to see what monthly amount closes the gap over the years you have left.
My father did this exercise at 71, which is later than ideal, and it still changed his next decade for the better. The number you get will probably be either reassuring or actionable. Both are better than the vague dread of not knowing.
If you want to stop before state pension age
Retiring at 55 or 60 rather than 67 changes two things at once, and people usually account for only one of them. The pot has to fund more years, and it has to fund the gap years entirely alone, without any state pension or Social Security underneath it. That gap period is the expensive part.
A UK example makes it concrete. Someone retiring at 58 with 40,000 pounds of annual spending needs the portfolio to cover all 40,000 until state pension age, which is currently 66 and rising. That is eight years at full load, roughly 320,000 pounds of spending before any state support arrives. After that the portfolio only needs to cover about 28,000 a year. Modelling it as a flat withdrawal for 35 years understates the early strain and overstates the later one.
Access rules matter just as much as totals. UK pensions are normally unavailable until 55, rising to 57 in 2028, so an early retiree needs a bridge held in ISAs or taxable accounts. In the US, the equivalent bridge is a taxable brokerage account, or planned strategies such as substantially equal periodic payments or a Roth conversion ladder. Getting the pot right and the access wrong is a common and painful mistake.
Inflation, care costs and the long tail
Two risks sit at the far end of a retirement plan and neither shows up in a simple multiplier. The first is inflation over 30 years. At 3 percent a year, prices roughly double in 24 years, so a 40,000 pound budget at 65 needs to be about 80,000 by 89 to buy the same life. This is the reason to keep a meaningful equity allocation deep into retirement rather than moving everything into cash.
The second is care. In the UK, residential care commonly runs between 50,000 and 70,000 pounds a year, with means testing that varies by nation. In the US, nursing home costs frequently exceed 100,000 dollars a year and Medicare does not cover long term custodial care. Most people will never need this, a minority will need it for years, and the distribution is brutally uneven. The usual responses are to keep housing equity as an explicit reserve, to consider long term care insurance where it is priced sensibly, or to accept that a late life care need would be funded by selling the home.
Neither risk argues for saving an impossible amount. They argue for keeping a reserve you do not count in your spending maths, and for reviewing the plan every three years rather than treating it as settled at retirement.
This article is general information and education, not personal financial advice. Figures are illustrative, based on long run averages and current public benefit levels that change over time. Investments can fall in value. A regulated adviser can model your specific tax position and retirement date.